The Eagle Nebula - M16
Messier 16, or the Eagle Nebula. The aptly named Pillars of Creation, featured in this stunning Hubble image, are part of an active star-forming region within the nebula and hide newborn stars in their wispy columns. M16 is the collective name for two distinct objects that are listed separately in astronomical catalogues: an emission nebula, referred to as IC 4703, and an open star cluster, designated as NGC 6611.
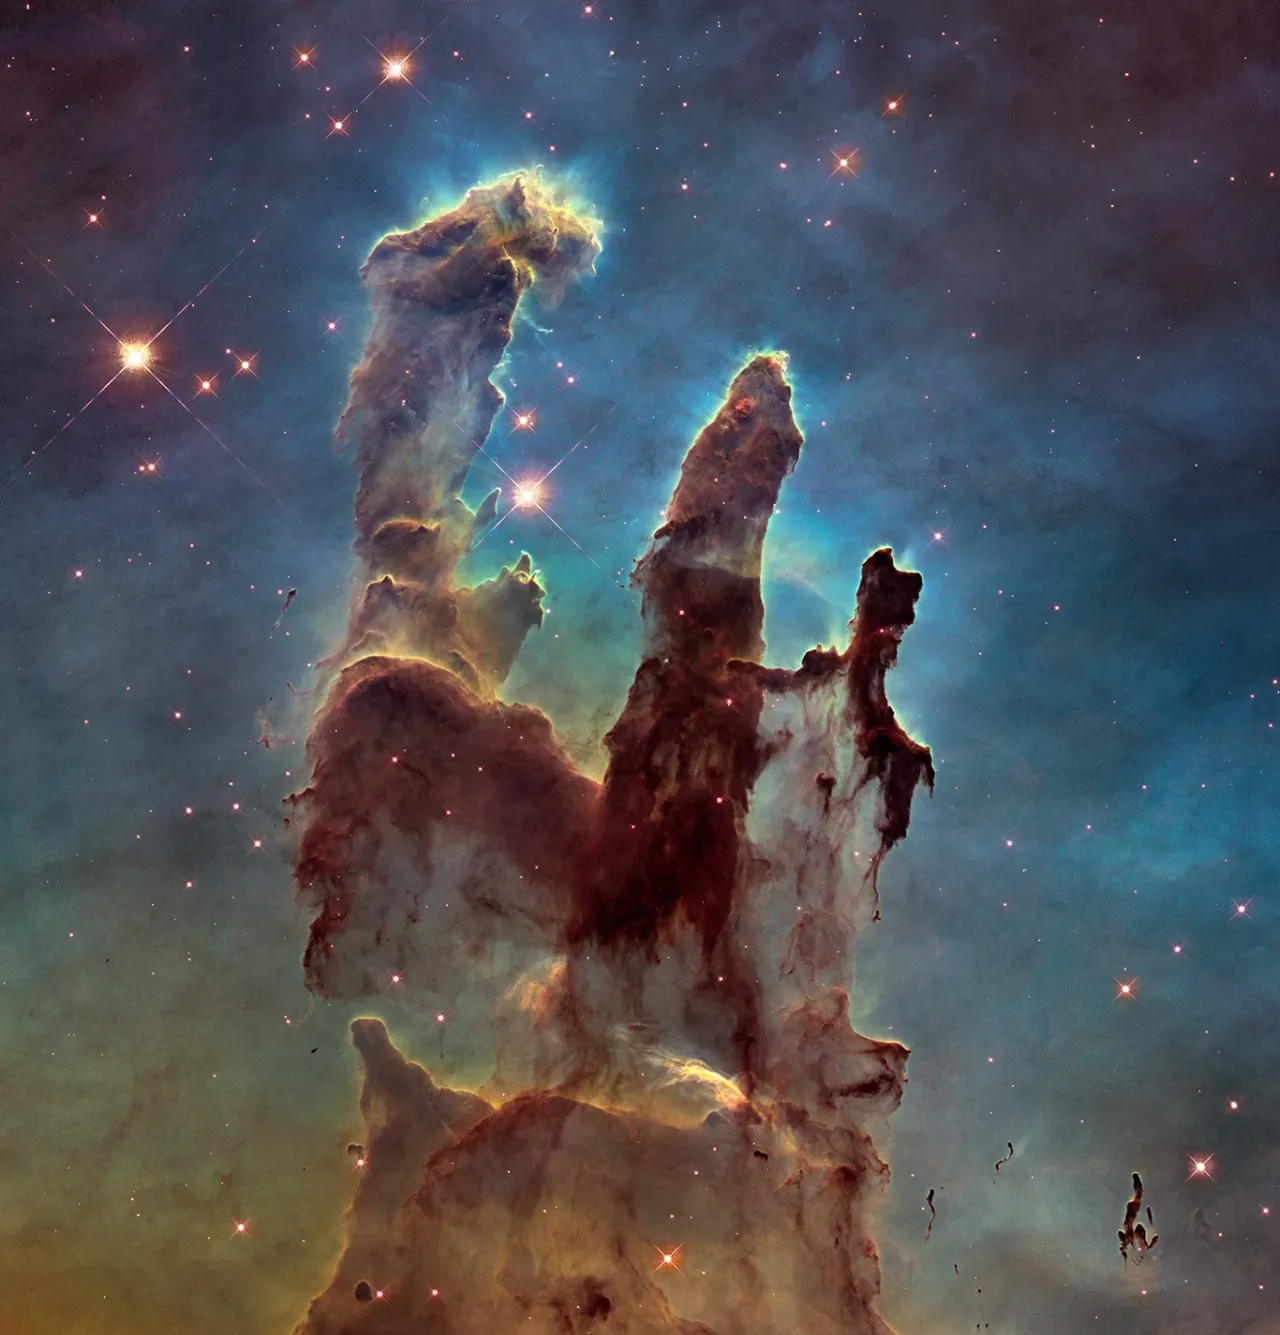
The famous Pillars of Creation, revealing a sharper and wider view of the structures in this visible-light image. Astronomers combined several Hubble exposures to assemble the wider view. The towering pillars are about 5 light-years tall. The dark, finger-like feature at bottom right may be a smaller version of the giant pillars.
NASA, ESA and the Hubble Heritage Team (STScI/AURA)
First in this section we are Importing Python Libraries such as astropy.io,numpy and reading the fits file.
In [1]:
#Import Libraries
from astropy.io import fits
import numpy as np
# read the file
jwst=fits.open('jw02739001004_06101_00003_nrcb3_o001_crf.fits')
#get information about the jwst fits file
jwst.info()
#get header information of data
header=jwst[1].header
print("header information is:")
header
#get image data
data=jwst[1].data #1 is for ImageHDU
data
np.shape(data)
Filename: jw02739001004_06101_00003_nrcb3_o001_crf.fits
No.    Name      Ver    Type      Cards   Dimensions   Format
  0  PRIMARY       1 PrimaryHDU     355   ()
  1  SCI           1 ImageHDU       156   (2048, 2048)   float32
  2  ERR           1 ImageHDU        10   (2048, 2048)   float32
  3  DQ            1 ImageHDU        11   (2048, 2048)   int32 (rescales to uint32)
  4  AREA          1 ImageHDU         9   (2048, 2048)   float32
  5  VAR_POISSON    1 ImageHDU         9   (2048, 2048)   float32
  6  VAR_RNOISE    1 ImageHDU         9   (2048, 2048)   float32
  7  VAR_FLAT      1 ImageHDU         9   (2048, 2048)   float32
  8  ASDF          1 BinTableHDU     11   1R x 1C   [35026B]
header information is:
Out[1]:
(2048, 2048)
In [2]:
%matplotlib widget
import matplotlib.pyplot as plt
from matplotlib.colors import LogNorm
plt.figure()
plt.imshow(data,norm=LogNorm(),cmap='gray', origin='lower') #image show
plt.title('Eagle Nebula (M16) - JWST Science Image')
plt.colorbar()
plt.show()

In [3]:
%matplotlib widget
import matplotlib.pyplot as plt
from matplotlib.colors import LogNorm
dq_data = jwst[3].data  # Assuming HDU 3 is the DQ map based on your file structure
plt.figure()
plt.imshow(dq_data,norm=LogNorm(),cmap='viridis', origin='lower') #image show
plt.title('Eagle Nebula (M16) - DQ Data')
plt.colorbar()
plt.show()

In [4]:
# Import matplotlib for visualization
import matplotlib.pyplot as plt

# Plot the science image
plt.figure()
plt.imshow(data, cmap='gray')  # Science image in grayscale

# Overlay the DQ map with transparency (alpha)
plt.imshow(dq_data, cmap='cool', origin='lower', alpha=0.5)  # DQ map in color with 50% transparency

# Add colorbar and labels
plt.colorbar(label="DQ Flags")
plt.title(" M16 - Science Image with DQ Overlay")
plt.show()

Eagle Nebula (M16) - Interactive Plot
Explore the JWST image of the Eagle Nebula. Zoom in to see fine details!
In [6]:
fig.write_html("interactive_eagle_nebula.html")